Figure 3.
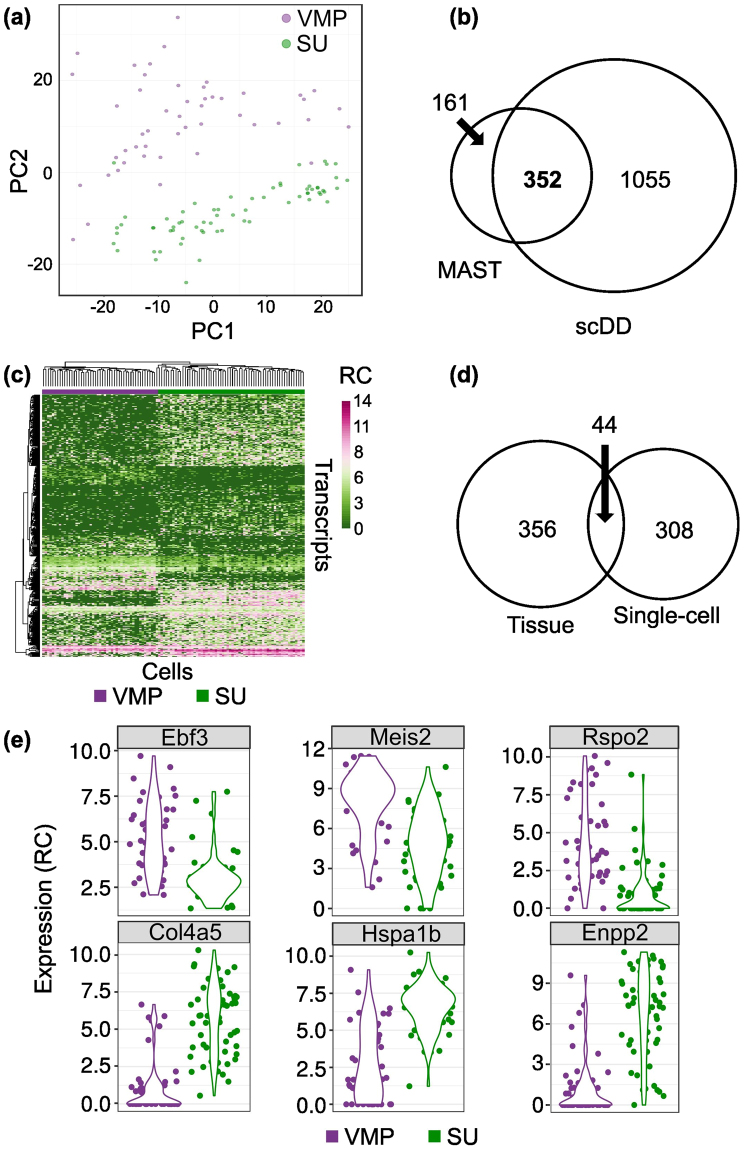
Single-cell RNA-seq of dissociated VMP and SU cells. Microdissected tissues were digested with collagenase to provide single cell suspensions for separation using a Fluidigm C1 microfluidic chip, and subsequent library preparation and sequencing. (a) PCA plot of whole transcriptome data distinguished VMP from SU cells. (b) Venn diagram showing the overlap between the DE transcripts identified by MAST (Benjamini-Hochberg adjusted P-value < 0.05) and the DE transcripts identified by scDD method (fold change > 1.5 and Benjamini-Hochberg adjusted P-value < 0.05). (c) Heatmap representing the log2 expression values (normalized read count + 1) (RC) of the common 352 DE transcripts between VMP and SU cells. (d) Venn diagram of DE transcripts identified by Tag-seq/RNA-seq and DE transcripts identified in scRNA-seq. 44 transcripts were common between both approaches. (e) Violin plots showing the distribution of log2 (normalized read count + 1) (RC) across VMP (top row) and SU (bottom row) cells for selected DE transcripts with adjusted P-value < 0.0001 identified by MAST and scDD.

