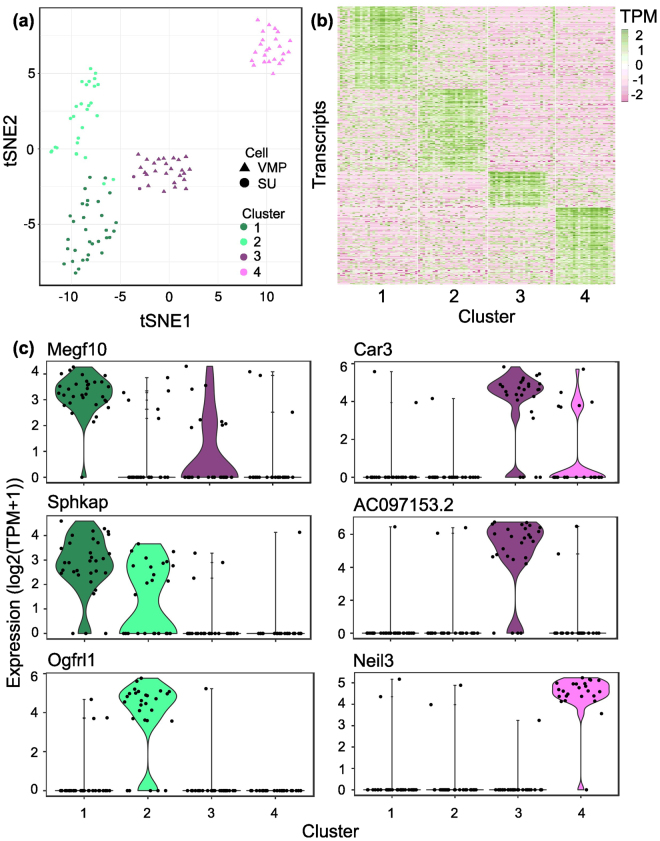
Figure 4.
Identification and characterization of distinct cell subpopulations within VMP and SU tissue compartments. (a) tSNE analysis identified markers of cell subpopulations that separates both VMP and SU in to two distinct VMP and two distinct SU cell subpopulations labeled clusters 1 through 4 respectively. (b) Expression heatmap of most discriminatory cluster markers (avg_diff > 0 and AUC > 0.75) across VMP and SU cell populations. Expression values presented as log2 (TPM + 1) (TPM). (c) Violin plots showing expression of selected cluster marker genes across VMP and SU cell populations. Expression is presented as log2 (TPM + 1). Width of the violin plot indicates frequency of cells with that expression level.

