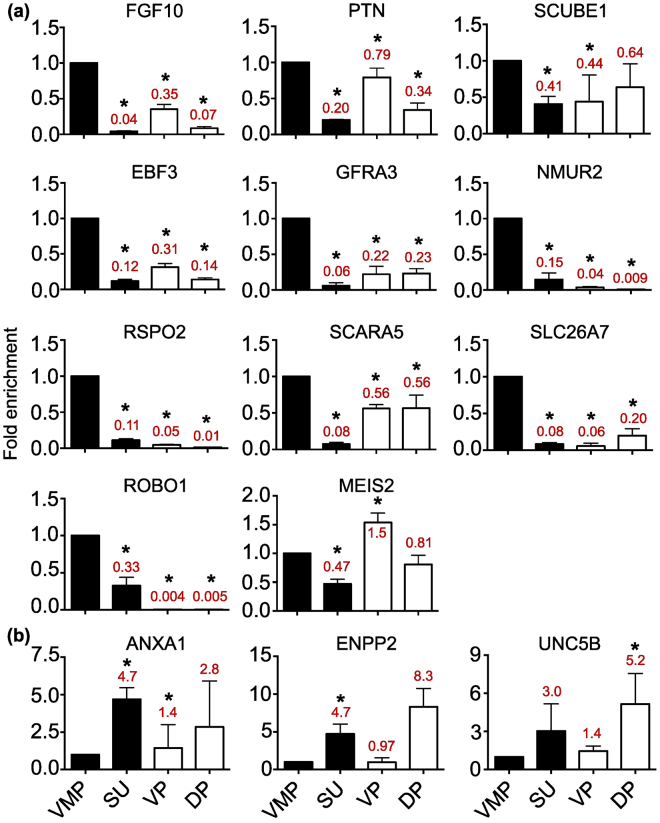
Figure 5.
Validation of VMP- and SU-specific transcript expression in female and male P0 rat tissues. Quantitative real-time PCR (qPCR) showed significantly elevated levels of both control (Fgf10, Ptn and Scube1) and candidate (Ebf3, Gfra3, Nmur2, Rspo2, Scara5, Slc26a7, Robo1 and Meis2) VMP-specific transcripts versus SU. Fgf10, Ptn, Scube1, Ebf3, Gfra3, Scara5 and Meis2 were expressed in VP and DP, while Rspo2, Nmur2 and Slc26a7 showed low expression in VP and DP. SU candidate transcripts Anxa1, Enpp2 and Unc5b were enriched versus VMP. Data is represented as mean fold difference to VMP ± SD of duplicate biological replicates and duplicate technical replicates (n = 4). Significance was detected using One-way ANOVA with TUKEY multiple comparison *p < 0.05. Figures in red indicate fold difference compared to VMP.

