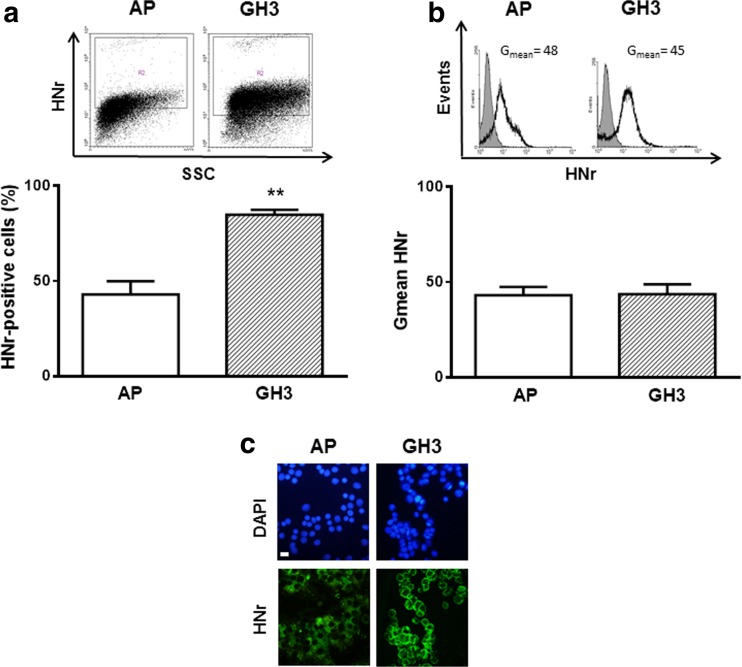
Fig. 1.
HNr expression in anterior pituitary cells from female rats was lower than in GH3 cells. Cultured anterior pituitary (AP) cells from female rats or GH3 cells were incubated with anti-HNr antibody and analyzed by flow cytometry. Each column represents the mean ± SE (n = 3) of the percentage of HNr-positive cells (a), and the fluorescence intensity of HNr staining (Gmean) (b). * * p < 0.01. Student’s t test. The upper panels show representative dot plots and histograms of HNr expression. (c) Representative images of immunofluorescence for HNr in AP cells and GH3 cells. Scale bars: 10 μm

