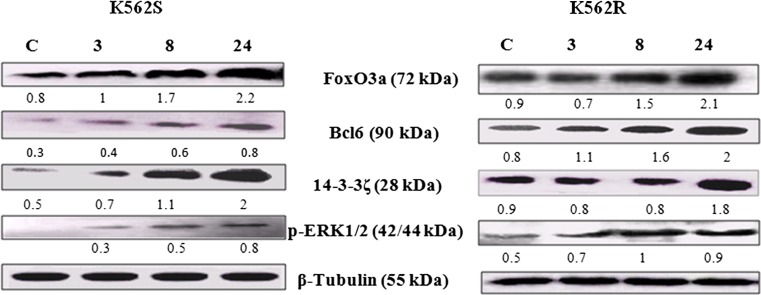
Fig. 3.
Evaluation of FoxO3a and Bcl6 protein expressions during megakaryocyte differentiation induced by PMA at different time intervals in K562S and K562R cells. K562S and K562R cells treated with10nM and 5 nM, respectively and the expressions of FoxO3a, Bcl6, 14–3-3ζ and p-ERK1/2 were determined at different time intervals by immunoblotting using monoclonal antibodies against the mentioned factors. The density of each band was estimated by densitometric analysis. Equal protein loading in each gel well was confirmed by the β-Tubulin content

