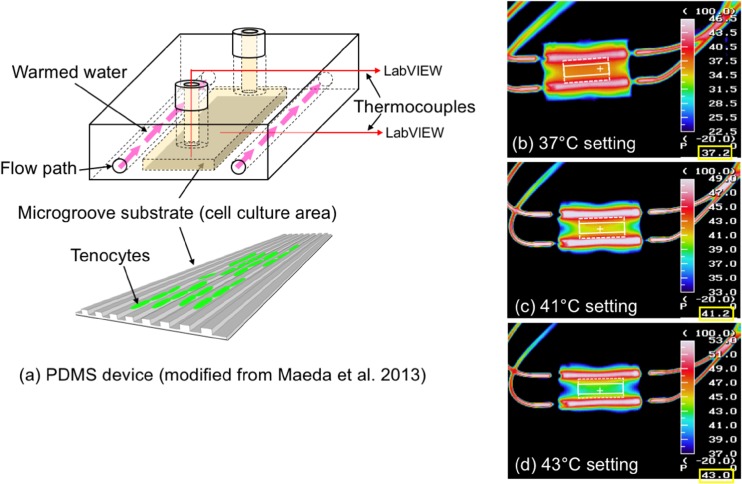
Fig. 1.
Experimental device for the application of heat stress. a A schematic of PDMS device used for the experiments. The device was modified from the original reported in Maeda et al. 2013. b-d The temperature distribution around the cell culture area when the temperature monitored in the cell culture area was 37 °C b, 41 °C c or 43 °C d. Images were captured from the bottom of the PDMS device using a thermographic camera (TH7102WV, NEC Sanei Co., Japan). Rectangular region (white solid line) was selected for FLIP and cell viability analysis. For gene expression analysis, cells were collected from the entire microgroove substrate (rectangular region with white broken line). The temperature at the cross (+) mark in white is indicated in the right bottom of each image (enclosed by yellow rectangles)

