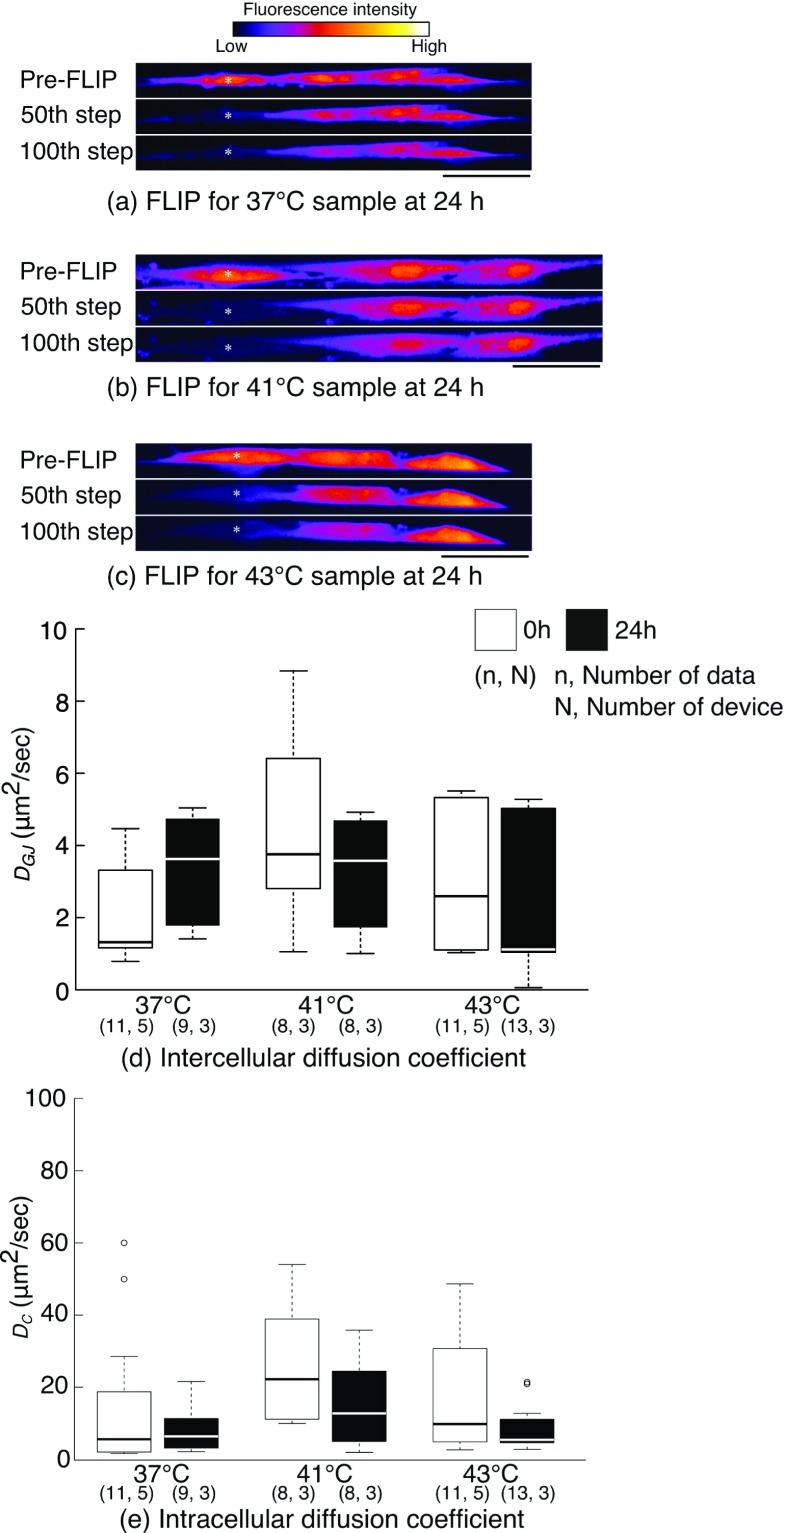
Fig. 2.
a-c Representative fluorescence images during FLIP experiments performed at 24 h after the stimulation. Tenocytes were stimulated with 37 °C a, 41 °C b or 43 °C c heat stress. White asterisks indicate the location of target cell. Bars = 50 μm. c, d Intercellular and intracellular diffusion coefficients obtained from FLIP experiments. 0 h indicates an experimental group examined immediately after the end of 30 min heat stimulation, and 24 h examined at the end of 24-h post-incubation period. Open circles indicate the values identified by outliers based on statistical criterion and were included in statistical analyses.

