
Fig. 4.
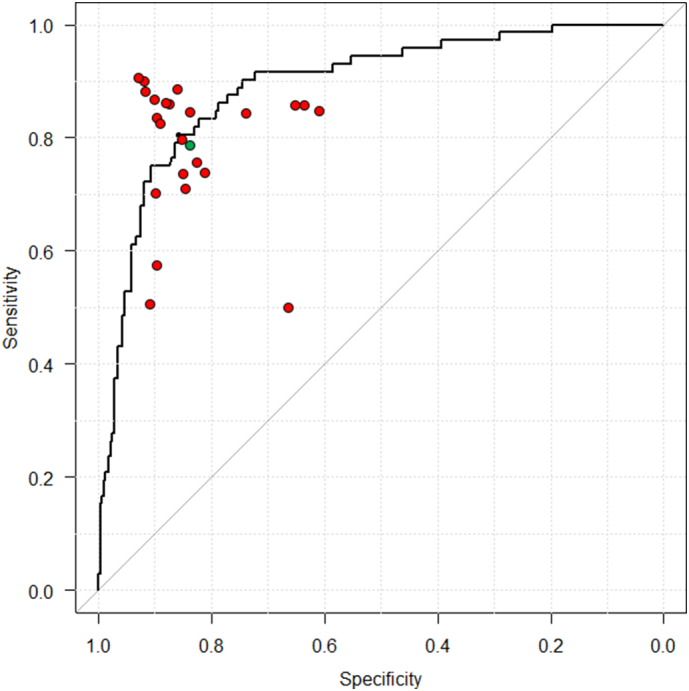
Receiver operating curves for CNN trained by uncategorized data and prediction of the endoscopists.
Each endoscopist's prediction is represented by a single red point. The green point is the average prediction of the endoscopists. The CNN outputs a H. pylori probability P per image, and then the program calculates a mean square of the probabilities per patient. The area under the receiver operating curve is over 89%.