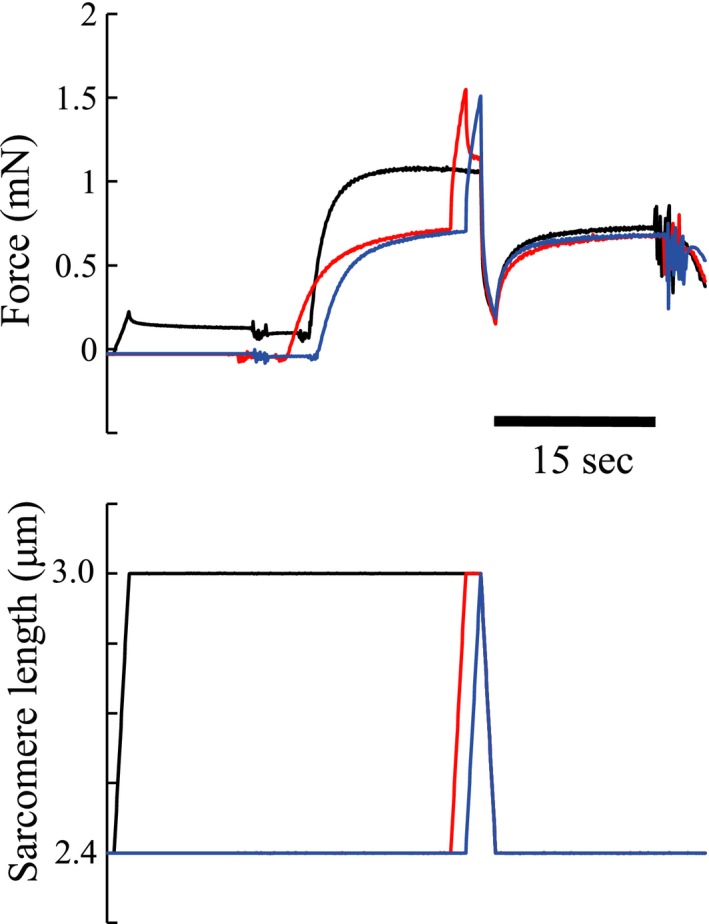
Figure 1.

Typical force and sarcomere length changes as a function of time for the three experimental conditions of Experiment 1. The black line indicates the control condition. The red line indicates the transition condition. The blue line indicates the stretch‐shortening cycle (SSC) condition.
