Figure 7.

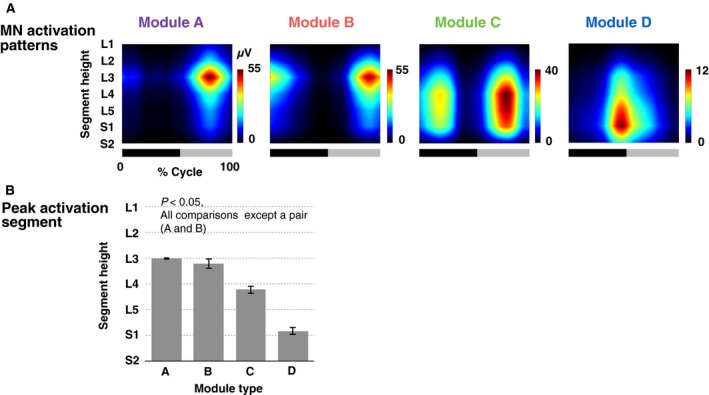
(A) MN activation patterns of motor modules normalized to MN numbers in each segment. The bars underneath denote the extension phase (black) and flexion phase (gray) of hip joint angle in a step cycle. (B) Group‐averaged peak activity segment height of the normalized MN activation patterns. Error bars indicate the standard errors.
