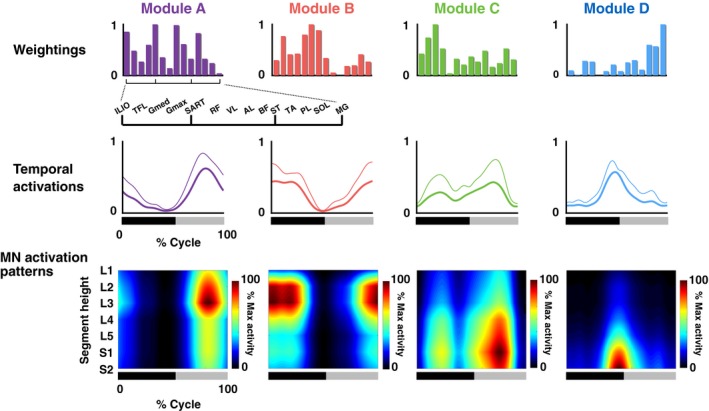
Figure 8.

Muscle weightings, temporal activation patterns, and MN activation patterns of the motor modules extracted from amplitude‐normalized EMGs. Average muscle weightings across participants in each type of modules are shown. Each bar height represents the relative level of activation of each muscle within the muscle weighting components. Lines indicate the temporal pattern components of the modules. Average patterns across participants (thick lines) and their standard deviations (thin lines) are presented. Heat map indicates MN activity patterns generated by each module. The bars underneath denote the extension phase (black) and flexion phase (gray) of hip joint angle in a step cycle.
