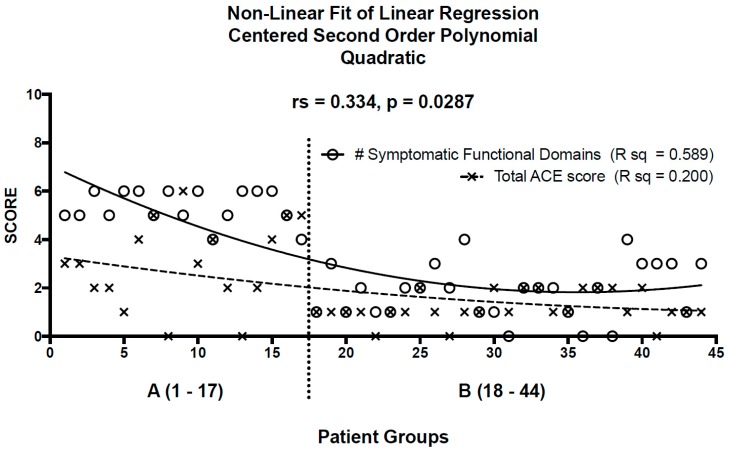
Figure 1.
Non-linear fit of linear regression using a centered, second-order polynomial quadratic equation gives rise to lines of best fit for patients in Group A (≥4 medically unexplained symptoms; n = 17) and Group B (<4 medically unexplained symptoms; n = 27) for the number of symptomatic functional domains (rs = 0.589) and total ACE score (rs = 0.20). There is a moderate and statistically significant correlation between the number of symptomatic functional domains and total ACE score for all patients (rs = 0.334, p = 0.0287).

