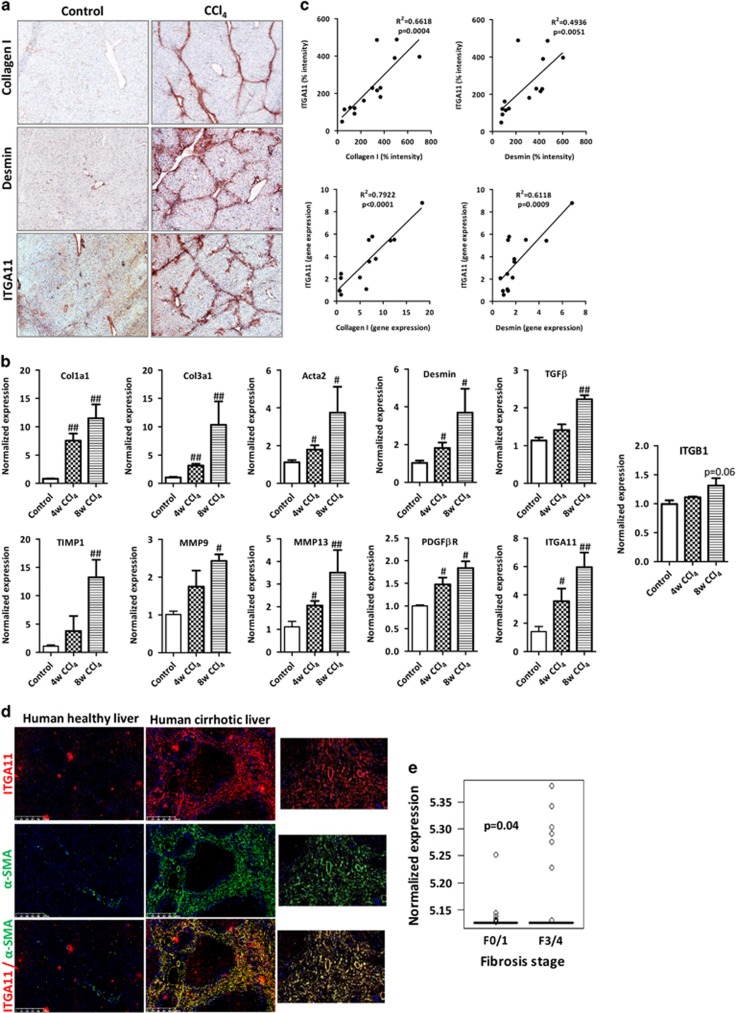
Figure 1.
Upregulation of ITGA11 in CCl4-induced chronic liver fibrosis in mice and fibrotic human livers. (a) Collagen-I, Desmin and ITGA11-stained liver sections from olive-oil-treated (control) and CCl4-treated (8 weeks, fibrotic) mice. n=5 per group. (b) Gene expression of fibrotic parameters (Col1a1, Col3a1, Tgfβ, Timp1, Mmp9 and Mmp13), myofibroblast activation markers (Acta2, Desmin and Pdgfβr) and Itga11 and Itgb1 in the livers of olive-oil-treated non-fibrotic control mice and CCl4-treated fibrotic mice (4 and 8 weeks). n=5 per group. #P<0.05 and ##P<0.01 versus control. (c) Correlative analysis of ITGA11 protein and gene expression with respect to the expression of fibrotic parameters (collagen-I and Desmin). The correlations were assessed using Pearson’s correlative analysis. ‘R2’ denotes Pearson’s correlation coefficient, and ‘P’ denotes statistical significance. (d) α-SMA- and ITGA11-stained human liver sections (n=4). Left, healthy human liver; middle, cirrhotic human liver; right, magnified image. Upper, ITGA11 (red); middle, α-SMA (green); bottom, merged image. Nuclei are stained blue with DAPI. (e) ITGA11 mRNA expression levels from publicly available transcriptome profiling data sets (www.ncbi.nlm.nih.gov/geo). Liver tissues affected with non-alcoholic fatty liver disease (NAFLD) stratified according to fibrosis stage: stage F0 or F1, mild fibrosis (n=40); stage F3 or F4, severe fibrosis (n=32) (GEO accession number: GSE49541).

