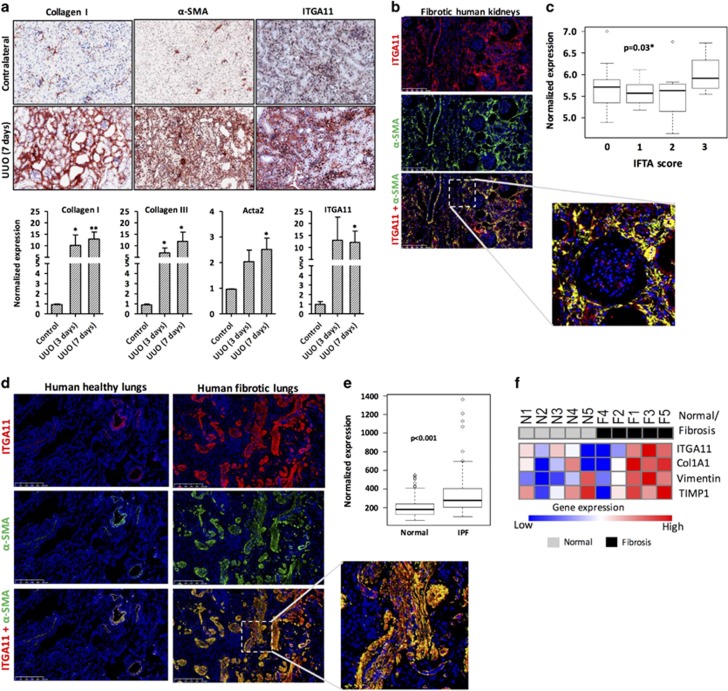
Figure 7.
Integrin alpha 11 (ITGA11) overexpression in the UUO model of kidney fibrosis in mice and in fibrotic human kidneys and fibrotic lung tissues. (a) Collagen-I-, α-SMA- and ITGA11-stained kidney sections obtained from sham- and 7 days UUO-operated mice (n=4 per group). Gene expression of fibrotic parameters (Col1A1, Acta2 and Col3A1) and ITGA11 in the kidneys from contralateral, 3-day and 7-day UUO-operated mice, n=4 per group. *P<0.05 and **P<0.01 versus contralateral kidneys. (b) α-SMA and ITGA11 co-immunostained human fibrotic kidney sections (n=4 per group). Upper, ITGA11 (red); middle, α-SMA (green); bottom, merged image. Nuclei are stained blue using DAPI. The lower panel depicts the magnified image. (c) The ITGA11 mRNA expression levels extracted from publicly available transcriptome profiling data sets (www.ncbi.nlm.nih.gov/geo). Kidney tissues stratified according to the IFTA score: 0, no fibrosis (n=16); 1, mild fibrosis (n=11); 2, moderate fibrosis (n=13); 3, severe fibrosis (n=8) (GSE25902), *P=0.03. (d) α-SMA and ITGA11 co-immunostained human lung sections (n=5 per group). Upper, ITGA11 (red); middle, α-SMA (green); bottom, merged image. Nuclei are stained blue using DAPI. (e) The ITGA11 mRNA expression levels were extracted from publicly available transcriptome profiling data sets (www.ncbi.nlm.nih.gov/geo). Lung tissues with idiopathic pulmonary fibrosis (n=123) compared with normal controls (n=96) (GSE47460). *P<0.001 versus normal lungs. (f) Heat map representation of the gene expression of ITGA11, Col1A1, Vimentin and TIMP1 in human lung slices. N1–N5 and F1–F5 denote normal and fibrotic samples, respectively.

