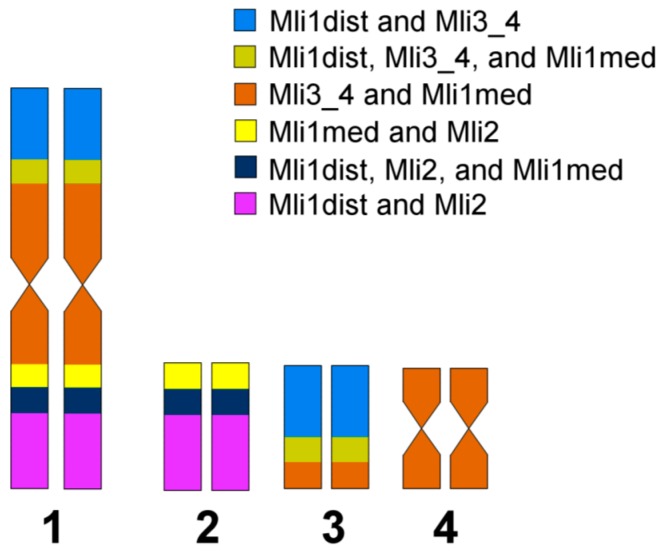
Figure 4.
Scheme of chromosomal regions in the M. lignano chromosomes based on painting patterns of microdissected DNA probes. The regions marked with different colors were painted with different combinations of DNA probes. They were drawn approximately according to the estimation of their size. Microdissected DNA probes derived from the chromosome region provided FISH signal smooth fading in the region borderline. As a result, the position of centromeres in chromosomes MLI2 and MLI3 was not determined precisely in colored bands. For this reason, the centromeres of chromosomes MLI2 and MLI3 were not shown on the scheme.

