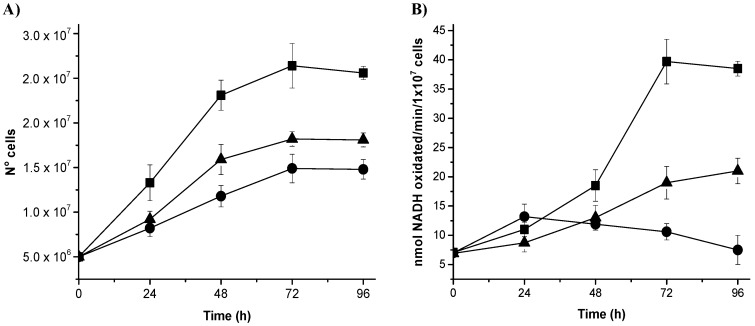
Figure 3.
Kinetics of cell growth (A) and NADHox enzyme activity (B) from the wild type (WT) strain (■) and N200 (●) and N400 (▲) transformants. The figures represent the average of three independent experiments. However, each of these three experiments were performed in triplicate, so the standard deviation is the reflection of 9 replicates at each time. For all experiments, the standard deviation was less than 10%.

