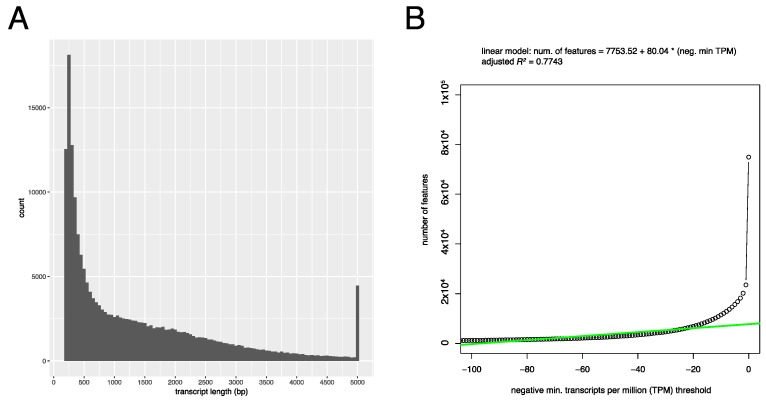
Figure 3.
Assembly transcript length distribution and estimation of expressed transcripts. a. Assembly transcript length distribution. (A) Histogram shows the binned counts of the lengths of individual transcripts represented by 50 bp bins. Sequences with length greater than 5000 were binned together. The minimum transcript length reported by Trinity is 200 bp. (B) Estimation of expressed number of transcripts supported by the sequenced dataset. Plotted as circles are the number of transcripts with a minimum transcripts per million (TPM) value in any one sample at each threshold (plotted as negative values). A linear regression model fit to values between –100 and –10 neg. min. TPM is shown as a green line. The y-intercept (7753.52) indicates the estimated number of expressed transcripts supported by the sequenced dataset.

