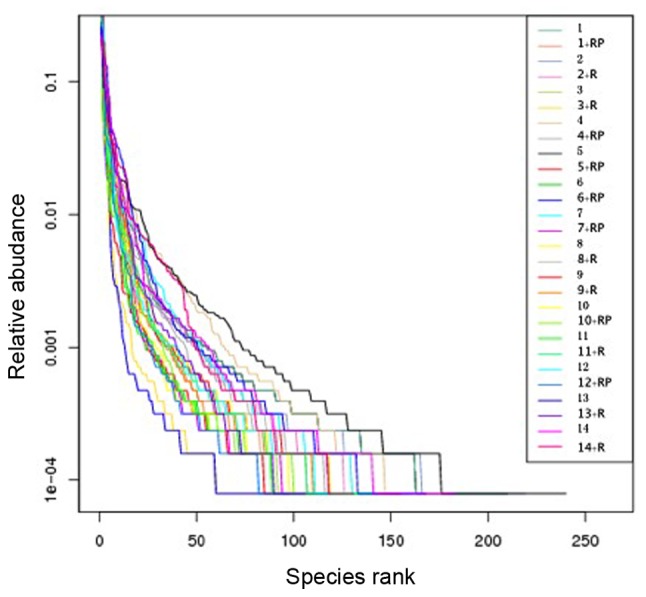
Figure 2.

Rank abundance, demonstrating the species richness and evenness in the sample, also revealed reduced microbiota diversity after treatment. The total number of species is shown in the maximum reading of each curve on the x-axis, while values on the y-axis demonstrate the relative abundance of each ranked species.
