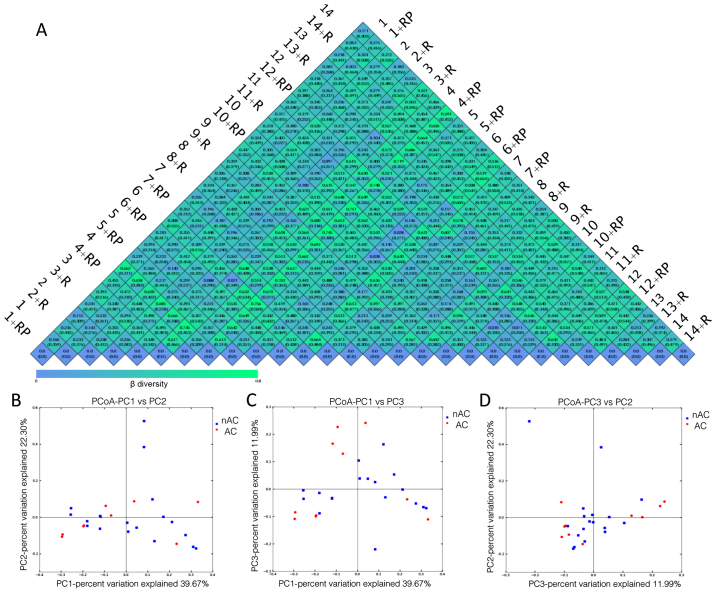
Figure 3.
Alcohol addiction compromises treatment efficacy. (A) Heatmap demonstrating the weighted (top value in each box) and unweighted (bottom value in each box) Unifrac values between two patients in a pairwise comparison, prior to or following treatment, as determined by β diversity analysis. (B) PcoA analysis of non-alcoholic and alcoholic patients in two principal coordinates (PC1 and PC2) using weighted Unifrac values. (C) PcoA analysis of non-alcoholic and alcoholic patients in two principal coordinates (PC1 and PC3) using weighted Unifrac values. (D) PcoA analysis of non-alcoholic and alcoholic patients in two principal coordinates (PC3 and PC2) using weighted Unifrac values.

