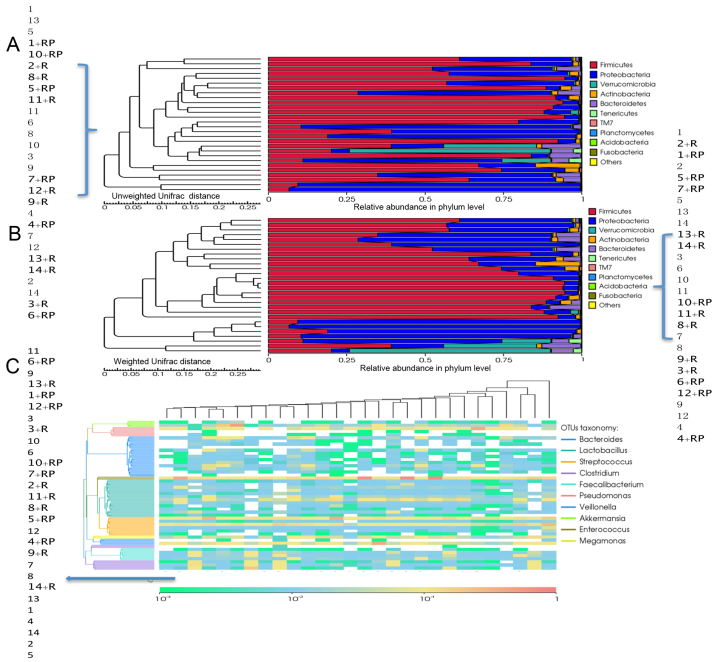
Figure 4.
Treatment leads to altered abundance in certain major phyla and genera. The relative abundances of gut microbiota at the phylum level and clustering of the samples are presented, using (A) unweighted (amplified sample list to the left) and (B) weighted Unifrac values (amplified sample to the right). (C) Clustering analysis at the genus level for each sample [amplified sample list to the left, with sample names transposed (top name denotes the left most sample, whereas the bottom name denotes the right most sample)].

