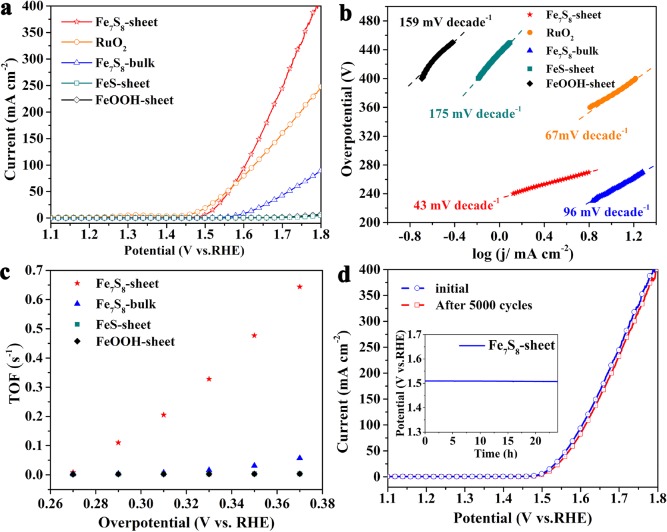
Figure 4.
Electrochemical behaviors. (a) LSV curves of the tested samples. (b) Corresponding Tafel plots. (c) A plot of TOFs with respect to Fe atoms of Fe-based catalysts at different overpotentials. (d) LSV curves of the Fe7S8 nanosheets after 5000 CV cycles; inset is the chronopotentiometric curve obtained in 1 M KOH solution.

