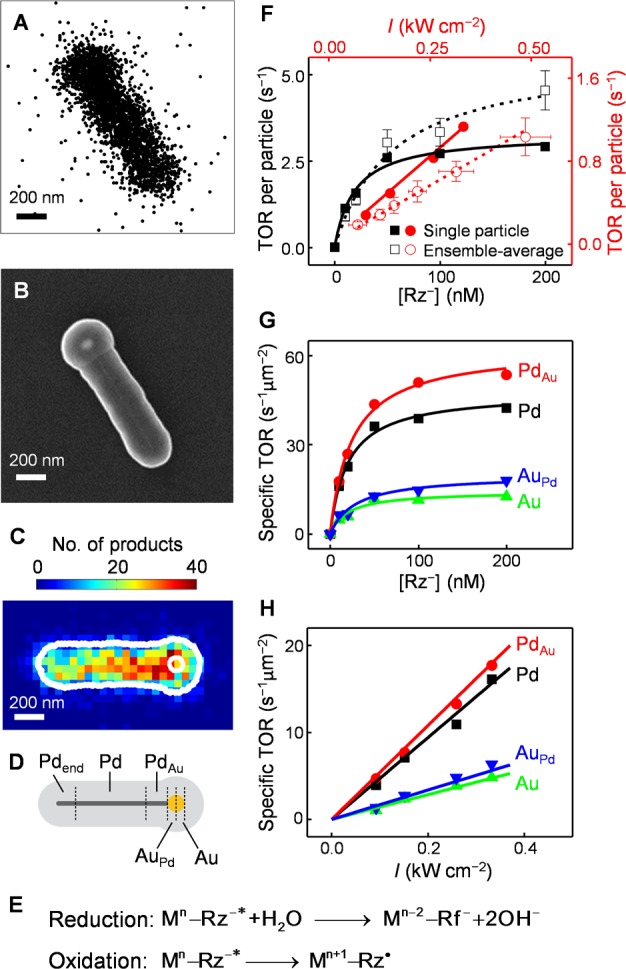
Figure 2.

Super-resolution catalysis imaging and single-to-sub particle level analysis of reaction kinetics of PdAu nanoparticles. (A) Positions of ∼2900 products detected on a single mesoporous silica coated PdAu nanoparticle. (B) SEM image of the nanoparticle in A. (C) Two-dimensional histogram of product positions on the nanoparticle in panels A and B in 50 × 50 nm2 bins. The nanoparticle has been reoriented to align horizontally. Outer white line, structural contour; white circle, the contour of the Au particle; both determined from the SEM image in panel B. (D) Segmentation of a typical PdAu nanoparticle: regions of monometallic Pd (Pd), Au-doped Pd next to the Pd–Au interface (PdAu), monometallic Au (Au), and Pd-doped Au next to the Pd–Au interface (AuPd). The end segment (Pdend) is described in section 2.6. (E) Proposed kinetic mechanism of the catalytic disproportionation. Mn–Rz–*: a metal-surface-adsorbed excited-state resazurin; n is the number of electrons on the metal; the changes in electron counts on the metal particle are denoted. (F) Reactant concentration [Rz–] (black) and 532 nm laser power density I (red) dependences of the turnover rate (TOR) per PdAu nanoparticle. Solid symbols: the single particle in panels A–C. Open symbols: results averaged over 53 nanoparticles. Error bars: SEM for y and SD for x. Solid and dashed lines: global fits of eq 1. (G, H) [Rz–] and I dependences of specific turnover rates of the segments (Pd, PdAu, Au, AuPd) for the nanoparticle in panels A–C.
