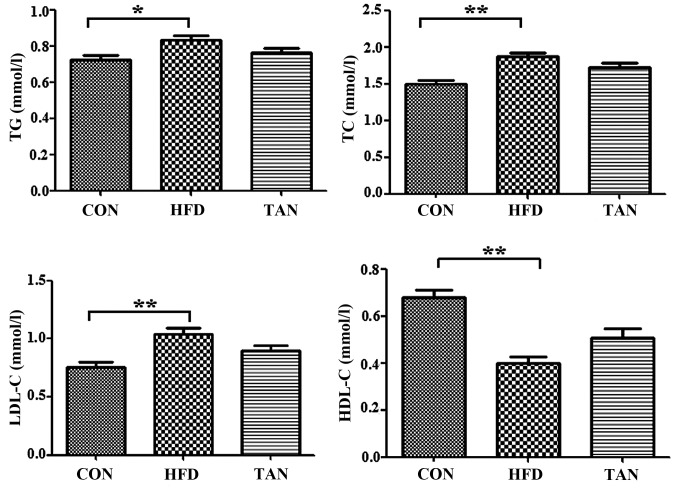
Figure 1.
Serum lipid profile. TG, TC, HDL-C and LDL-C levels were determined using corresponding test kits in the CON, HFD and TAN groups. Data are presented as the mean + standard deviation (n=6). *P<0.05; **P<0.01. CON, control group; HFD, high-fat diet group; TAN, tanshinone II A treatment group; TG, thyroglobulin; TC, total cholesterol; HDL-C, high density lipoprotein cholesterol; LDL-C, low density lipoprotein cholesterol.

