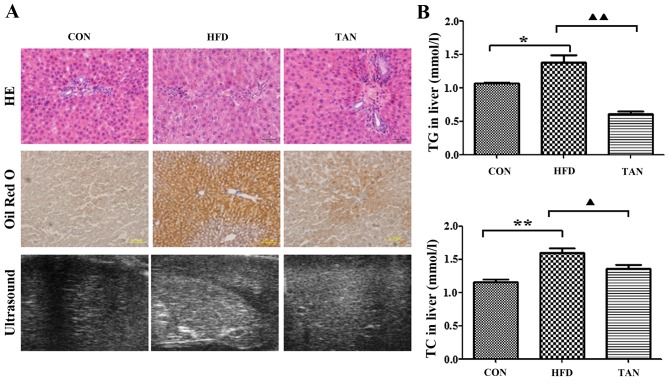
Figure 2.
Differences in morphology and lipid deposition in rats from the CON, HFD and TAN groups. (A) Morphological observation of rat hepatocytes in CON, HFD and TAN groups by HE staining, Oil Red O staining and high-resolution ultrasound. (B) TG and TC were measured by the COD-CE-PAP and GPO-PAP methods, respectively, in the livers of CON, HFD and TAN rats. Data are presented as the mean + standard deviation (n=3). *P<0.05; **P<0.01; ▲P<0.05; ▲▲P<0.01. CON, control group; HFD, high-fat diet group; TAN, tanshinone II A treatment group; TG, thyroglobulin; TC, total cholesterol; HE, hematoxylin and eosin.

