Figure 13.

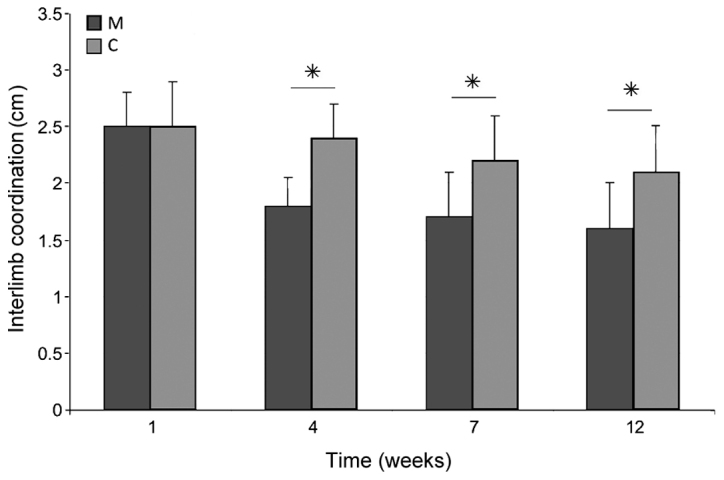
Interlimb coordination after spinal cord injury in the M and C groups. Data are presented as the mean ± standard deviation. *P<0.05 as indicated. C, control group; M, experimental group.

Interlimb coordination after spinal cord injury in the M and C groups. Data are presented as the mean ± standard deviation. *P<0.05 as indicated. C, control group; M, experimental group.