
Figure 9.
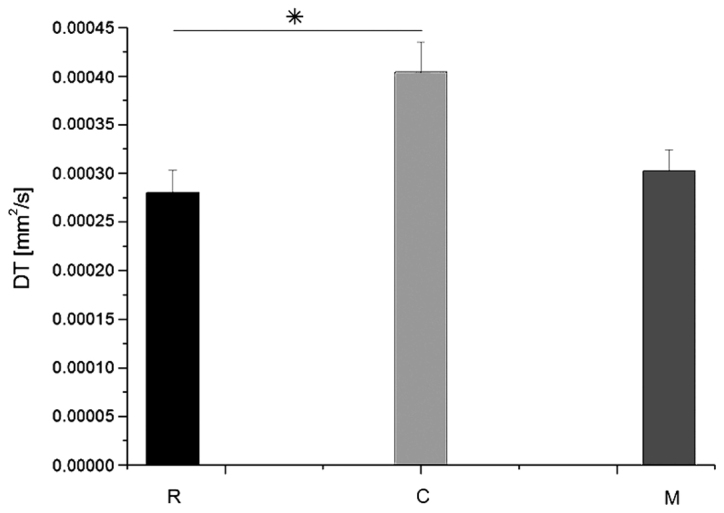
Average values of DT in groups R, C and M. Data are presented as the mean ± standard deviation. *P=0.027 as indicated. DT, transverse diffusion coefficient; R, reference group; C, control group; M, experimental group.
Official websites use .gov
A
.gov website belongs to an official
government organization in the United States.
Secure .gov websites use HTTPS
A lock (
) or https:// means you've safely
connected to the .gov website. Share sensitive
information only on official, secure websites.
Average values of DT in groups R, C and M. Data are presented as the mean ± standard deviation. *P=0.027 as indicated. DT, transverse diffusion coefficient; R, reference group; C, control group; M, experimental group.