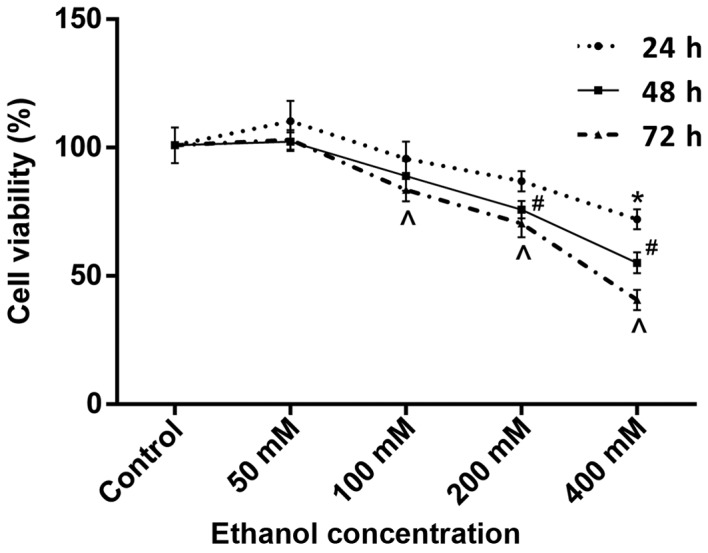
Figure 1.

Cell viability following treatment with different doses of ethanol. Cell viability was determined using an MTS assay. Data are presented as the mean ± standard deviation and experiments were performed in triplicate. *P<0.05 vs. control at 24 h; #P<0.05 vs. control at 48 h; ^P<0.05 vs. control at 72 h.
