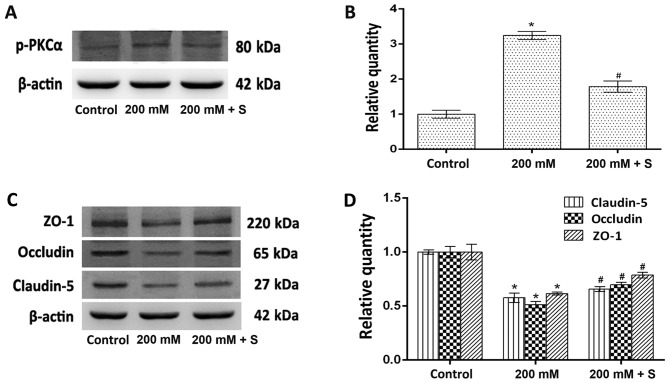
Figure 4.
Effect of the ethanol-induced increase in p-PKCα expression on claudin-5, occludin and ZO-1 expression. (A) Western blotting analysis of p-PKCα and β-actin protein expression. (B) Quantitative analysis of p-PKCα protein expression relative to β-actin expression. (C) Western blotting analysis of claudin-5, occludin and ZO-1 protein expression. (D) Quantitative analysis of claudin-5, occludin and ZO-1 protein expression relative to β-actin expression. The results (n=5) are presented as the mean ± standard deviation. *P<0.05 vs. control; #P<0.05 vs. 200 mM ethanol. p-PKCα, phosphorylated-protein kinase Cα; ZO-1, zonula occludens-1; S, safingol.

