
Figure 7.
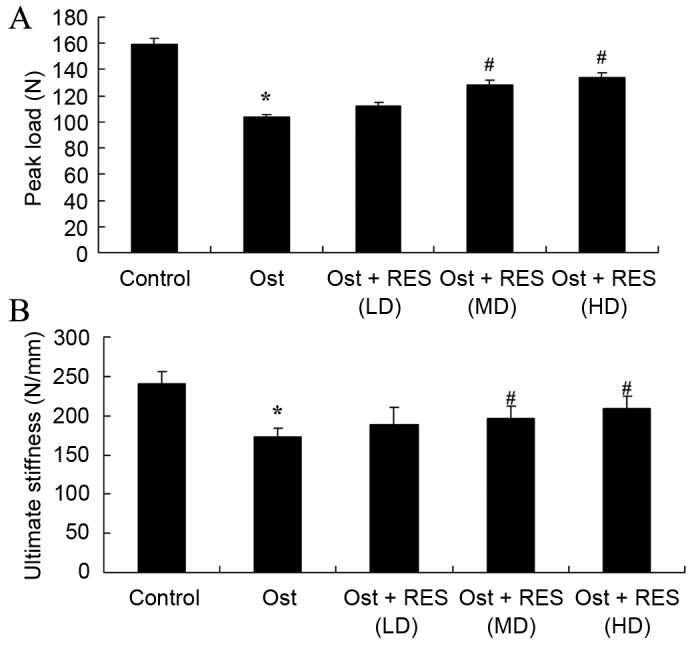
Bone mechanical tests, showing the percentages of (A) peak load and (B) ultimate stiffness of the femur in osteoporosis rats. *P<0.01 vs. control group; #P<0.01 vs. Ost group. Ost, osteoporosis; RES, resveratrol; LD, low-dose; MD, middle-dose; HD, high-dose.