Fig. 7.

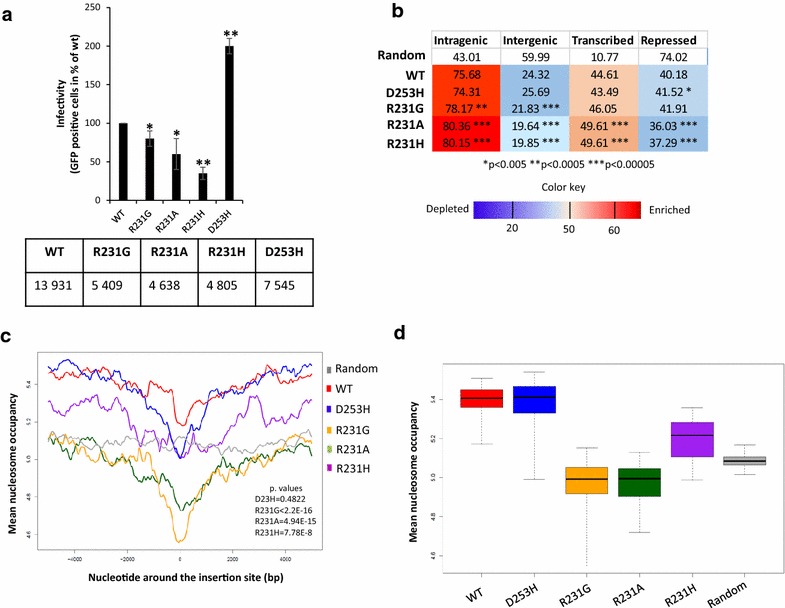
Effect of mutations disturbing the IN/H4 tail interaction on HIV-1 integration site selectivity. K562 cells were transduced with VSV-G pseudotyped lentiviruses encoding either WT IN or the R231A/H/G or D253H IN mutants. Viral replication was quantified based on eGFP fluorescence measured by FACS 48 h post-transduction. The data obtained shown in (a) are expressed as the percentage of eGFP-positive cells at a MOI of 1. The number of independent insertion sites analyzed is also reported. Position of human genes and multivariate genome segmentation data were used to count the insertion sites of the WT and the mutant viruses in intra- and intergenic, predicted transcribed and repressed (b) regions of the K562 genome [43]. Numbers indicate percentage values of insertion sites per condition. The color code stands for depletion or enrichment in the number of the insertion sites compared to a random expected frequency. The p values were calculated with Fisher’s exact test between the values of WT and the mutants,*p < 0.05 and **p < 0.005. The nucleosome density signal maps were generated from the results of mononucleosome core DNA sequencing using micrococcal nuclease digestion (MNase-seq, [23]) performed on chromatin of K562 cells. Nucleosome occupancy scores in windows of ± 5 kb around the insertion sites is shown for WT and mutant viruses shows the mean nucleosome coverage of the nucleotides around the insertion sites within 10 kb windows (c). The gray line depicts the mean nucleosome coverage of nucleotides around a genomic-wide set of random loci. The overall mean nucleosome occupancy values for the ± 5 kb windows around the insertion sites is shown in (d). The y axes show the average nucleosome occupancy scores around the insertion loci of the WT and the mutant viruses in 4 kb windows around the integration sites in K562 cells. The nucleosome occupancy values measured for random control is reported as a grey line. The p values were calculated by Student’s t-test and are shown as **p < 0.005 to represent the probability of obtaining significant differences compared with WT data
