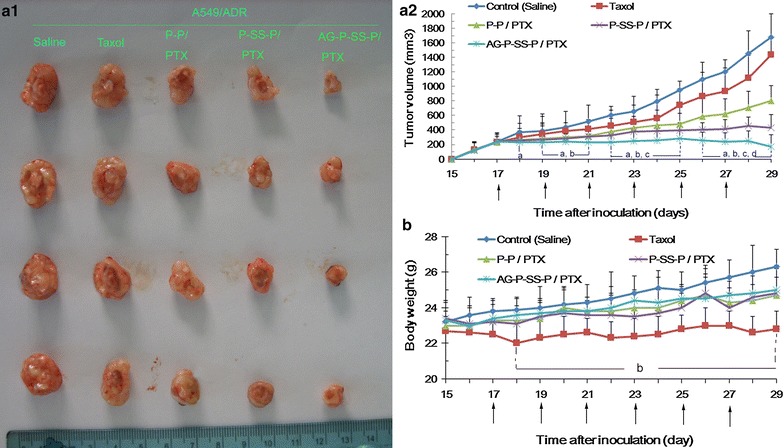
Fig. 7.

Tumor images (a1) and tumor growth inhibition graph (a2) for a murine model with A549/ADR xenografts after intravenous injection with the different formulations. b Body weight changes of the tumor-bearing mice after treatment with the various formulations. The arrow indicates the day of drug administration. The data are presented as the means ± standard deviations (n = 5); aP < 0.05 compared with the control; bP < 0.05 compared with Taxol; cP < 0.05 compared with P-P/PTX; and dP < 0.05 compared with P-SS-P/PTX nanomicelles
