Fig. 2.

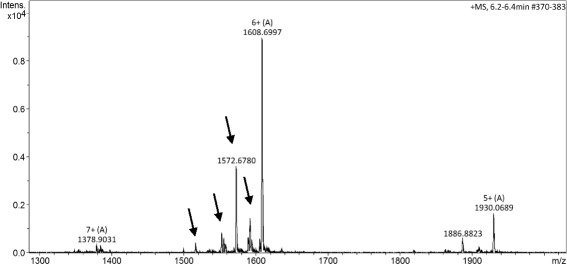
F3 ESI+ MS spectrum. The charge states of the major ions are presented above the m/z value. The presence of isoforms is indicated by the arrows for the [M + 6H]6+ ion

F3 ESI+ MS spectrum. The charge states of the major ions are presented above the m/z value. The presence of isoforms is indicated by the arrows for the [M + 6H]6+ ion