Fig. 3.

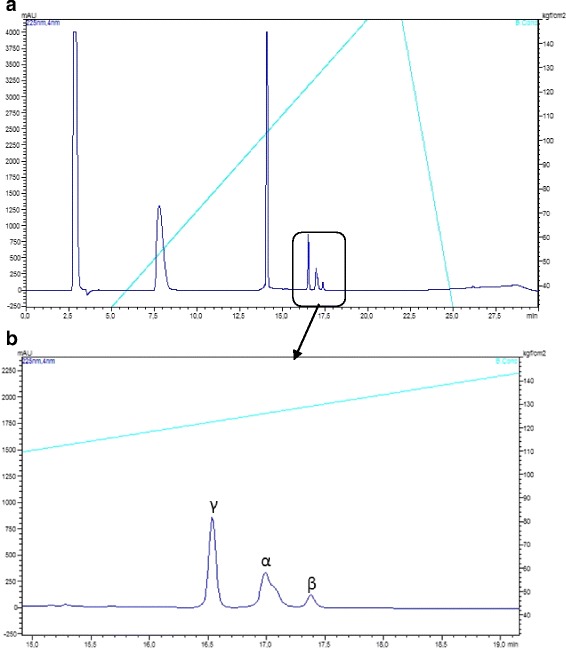
a Reduced and alkylated crotapotin (F3) RP-HPLC separation chromatographic profile. b Zoomed region with the identification of the individual chains. UV monitoring 225 nm. The major peaks in A correspond to the alkylation reagents

a Reduced and alkylated crotapotin (F3) RP-HPLC separation chromatographic profile. b Zoomed region with the identification of the individual chains. UV monitoring 225 nm. The major peaks in A correspond to the alkylation reagents