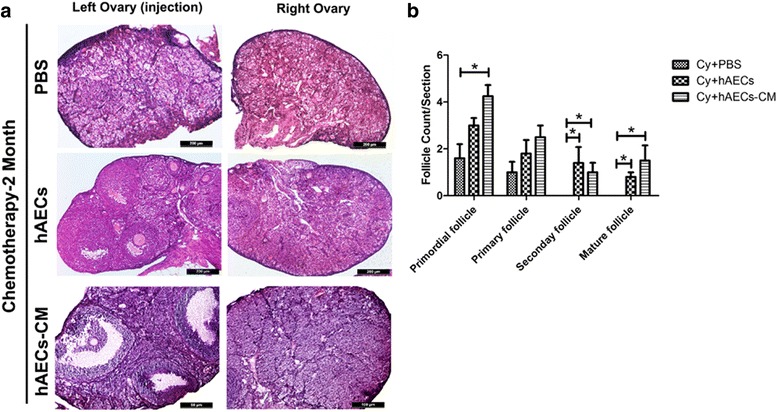
Fig. 2.

Follicular development and counting in the injured ovaries. a Representative images of H&E-stained ovarian sections obtained from different groups at 2 months after hAECs or hAEC-CM treatment. b Column displayed the number of primordial, primary, secondary and mature follicles per ovary in different groups. Data represent means ± SEM. Cy group, n = 4; Cy + hAECs group, n = 4; Cy + hAEC-CM group, n = 4. Scale bar is 200 μm in A
