
Fig. 2.
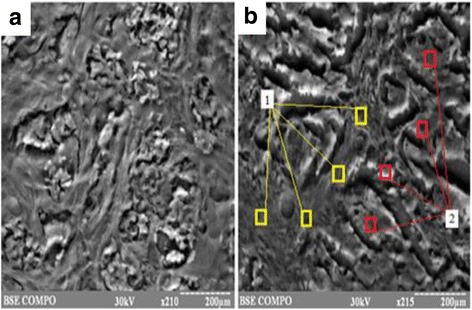
The scanning images of IDC tissue. a – local scanning of the sample surface (х210), b – focal scanning (х215): 1 – stromal component of tissue, 2 – parenchymal component of tissue
Official websites use .gov
A
.gov website belongs to an official
government organization in the United States.
Secure .gov websites use HTTPS
A lock (
) or https:// means you've safely
connected to the .gov website. Share sensitive
information only on official, secure websites.
The scanning images of IDC tissue. a – local scanning of the sample surface (х210), b – focal scanning (х215): 1 – stromal component of tissue, 2 – parenchymal component of tissue