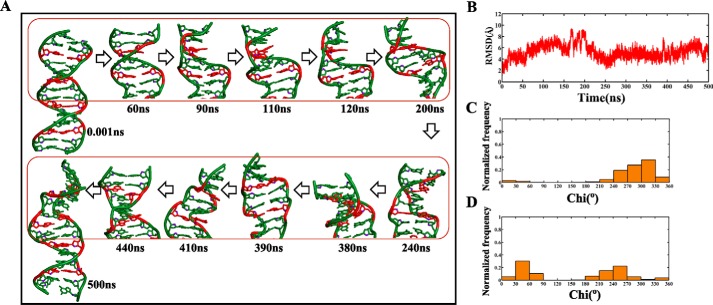
Figure 3.
Evolution of the B–Z junction in the d(GAC)6.d(GAC)6 duplex with +syn … anti glycosyl conformation for the mismatch. A, snapshots showing the unwinding of the helix because of Z-DNA evolution, resulting in negative supercoiling. The A … A mismatch is colored red. B, time versus RMSD profile illustrating (RMSD > 4Å) significant conformational changes taking place with respect to the starting model. C and D, glycosyl torsions showing (C) Gs favoring ±syn and (D) As favoring high-anti/+syn conformations, respectively.

