Figure 1.
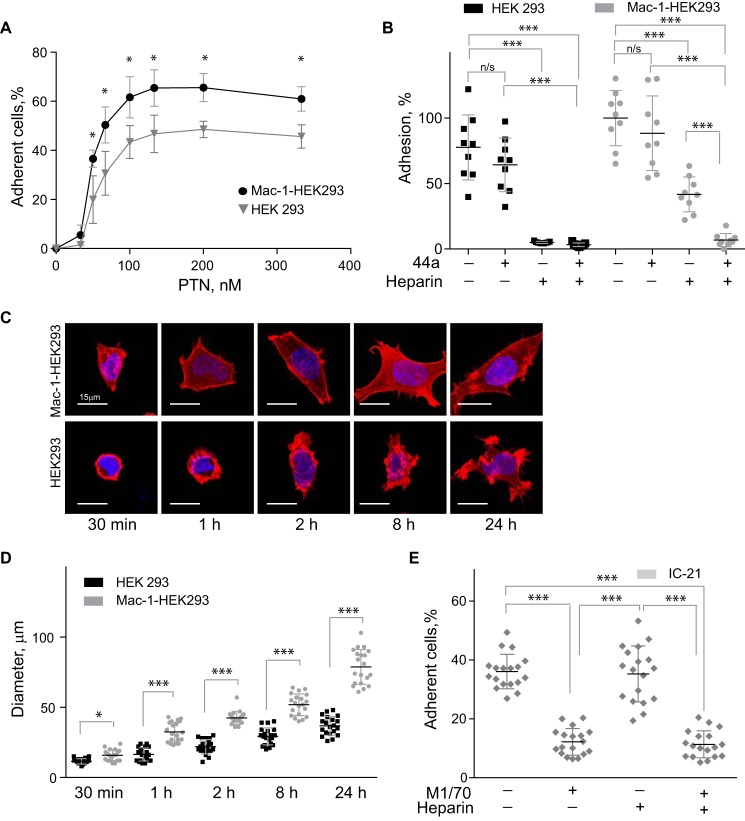
PTN supports adhesion and spreading of Mac-1–expressing HEK293 cells and IC-21 macrophages. A, aliquots (100 μl; 5 × 10⁴/ml) of Mac-1 HEK293 and HEK293 cells labeled with calcein were added to microtiter wells coated with different concentrations of PTN and postcoated with 1% PVP. After 30 min at 37 °C, nonadherent cells were removed by washing, and fluorescence of adherent cells was measured in a fluorescence plate reader. Data shown are means ± S.E. from three separate experiments with triplicate measurements. *, p ≤ 0.05. Statistically insignificant differences are not labeled. B, Mac-1 HEK293 cells and HEK293 cells were preincubated with anti-αM mAb 44a (5 μg/ml), heparin (1 μg/ml), or a mixture of both for 20 min and added to wells coated with 100 nm PTN. Adhesion in the absence of Mac-1 inhibitors and heparin was assigned a value of 100%. Data shown are means ± S.E. Error bars represent S. E. from three separate experiments with triplicate measurements. ***, p ≤ 0.001 compared with control adhesion in the absence of inhibitors; n/s, not significant. C, Mac-1 HEK293 (upper panel) and HEK293 cells (lower panel) were plated on glass slides coated with 100 nm PTN and allowed to adhere for different durations at 37 °C. Nonadherent cells were removed, and adherent cells were fixed with 2% paraformaldehyde and permeabilized with 0.1% Triton X-100 in PBS followed by staining with Alexa Fluor 546 phalloidin (actin) and DAPI (DNA). The cells were imaged with a Leica SP5 laser-scanning confocal microscope with a 63×/1.4 objective. D, the diameter of 20–50 Mac-1 HEK293 and HEK293 cells was calculated for each time point from images captured with a 20×/0.50 objective. Data shown are means ± S.E. from five random images for each time point from one to four experiments. Error bars represent S. E. *, p ≤ 0.05; ***, p ≤ 0.001. E, IC-21 macrophages were preincubated with anti-mouse αM mAb M1/70 (10 μg/ml), heparin (1 μg/ml), or a mixture of both and added to wells coated with 100 nm PTN. Data shown are means ± S.E. from three separate experiments with six measurements. Error bars represent S. E. ***, p ≤ 0.001.

