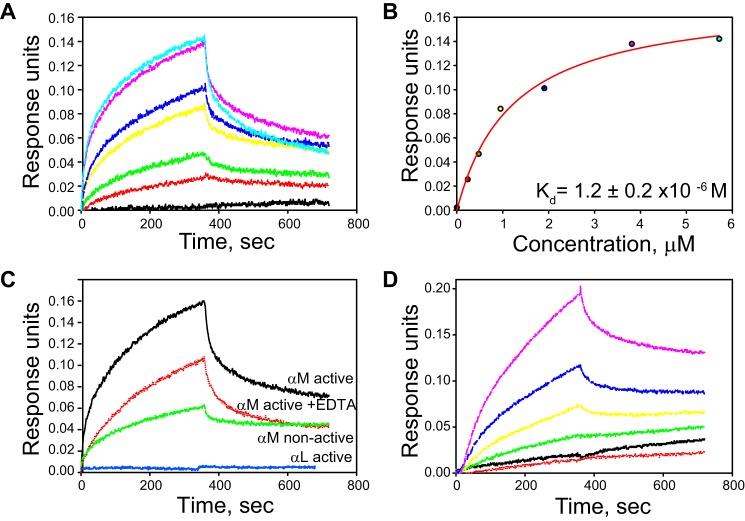
Figure 5.
Analyses of binding of the αMI domains to PTN by BLI. A, representative sensorgrams of titration of PTN immobilized on the ForteBio sensor with active αMI domain (0, 0.24, 0.48, 0.95, 1.9, 3.8, and 5.7 μm). B, saturable binding curve for the interaction of the αMI domain with PTN. Representative data from three independent experiments are shown. C, comparison of the ability of different I domains (5.7 μm) to bind PTN. The interaction between the active αMI domain and PTN in the presence of 5 mm EDTA is also shown. Representative data of three separate experiments are shown. D, representative binding curves of titration of biotinylated PTN immobilized on the ForteBio streptavidin sensor with active αMI domain (0, 0.15, 0.3, 0.75 1.5, and 3.0 μm).

