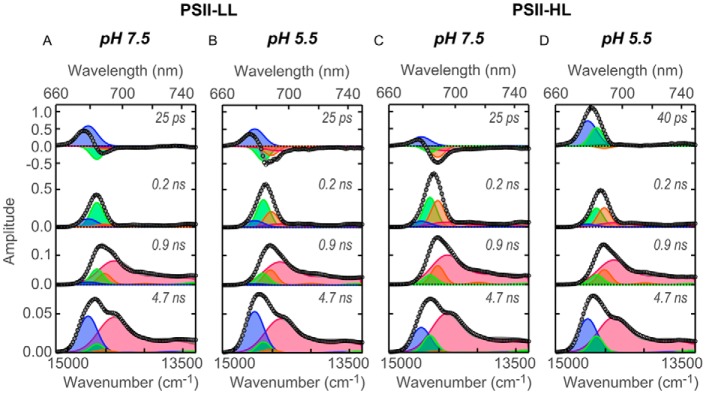
Figure 2.
Fluorescence decay–associated spectra of PSII supercomplexes at 77 K. FDAS were derived from the time-resolved fluorescence profiles of PSII supercomplexes obtained by excitation at 408 nm. Spectral components of global analysis were shown as blue (679 nm), green (684 nm), orange (689 nm), and red (694 nm). Open circles and gray lines represent FDAS spectra and fitting curve, respectively. A, PSII-LL at pH 7.5; B, PSII-LL at pH 5.5; C, PSII-HL at pH 7.5; and D, PSII-HL at pH 5.5.

