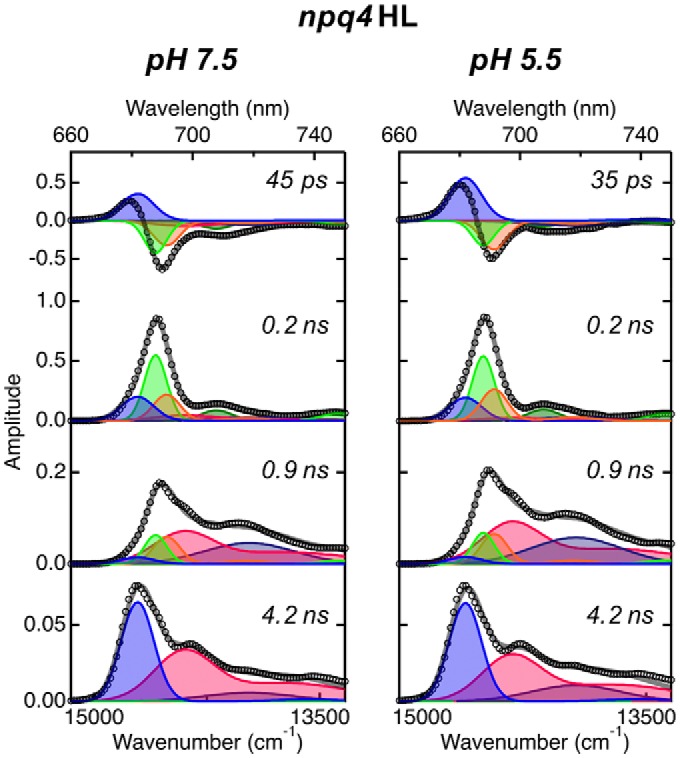
Figure 3.

Fluorescence decay–associated spectra of PSII supercomlexes isolated from npq4 mutant grown under high-light conditions at 77 K. Time-resolved fluorescence profiles were obtained at each wavelength by excitation at 408 nm and analyzed to generate FDAS using the same procedure as described in the legend to Fig. 2. Spectral components of global analysis were shown as blue (680 nm), green (685 nm), orange (689 nm), red (694 nm), dark green (705 nm), and navy (715 nm). Open circles and gray lines represent FDAS spectra and fitting curve, respectively.
