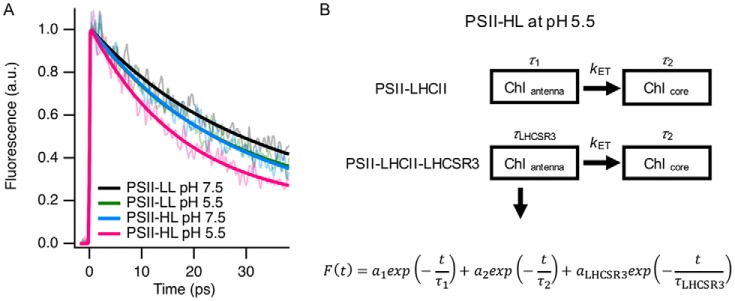
Figure 4.
Up-conversion fluorescence decay curves of PSII supercomplexes at room temperature. A, fluorescence decay curves were obtained with an up-conversion system by excitation at 425 nm. Each fluorescence decay curve is an average of 16∼24 measurements. Fresh samples were used for every four measurements. Fluorescence decay curves were normalized at the peak of fitting line. B, the decay fitting was carried out with a heterogeneous-PSII fitting model considering heterogeneous populations of PSII supercomplexes in PSII-HL. aLHCSR3 represents the amplitude of the LHCSR3-related component in PSII-HL. Details are as described under “Experimental procedures.”

