Figure 5.
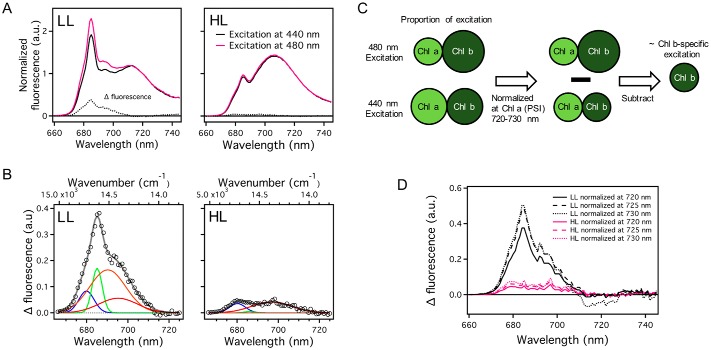
Steady-state fluorescence emission spectra at 77 K of low light- and high light-grown C. reinhardtti. A, the spectra were normalized at 720 nm, which is believed to not contribute to PSII-related fluorescence. The difference spectra were derived by subtraction of the spectrum obtained by 440 nm excitation from the spectrum obtained by 480 nm excitation. B, the spectra were globally fitted with four Gaussian functions. The amplitudes of the Gaussian functions are independent of other spectra but their center and width are linked in the two spectra. Spectral components of global analysis were shown as blue (679 nm), green (685 nm), orange (689 nm), and red (694 nm). Open circles and gray lines represent FDAS spectra and fitting curve, respectively. LL, low light-grown cells; HL, high light-grown cells. C, an illustration of the analysis procedure to investigate fluorescence spectrum by Chl b-specific excitation. 480-nm light preferentially excites Chl b, whereas 440-nm light equally excites Chl a and Chl b. To investigate the fluorescence spectrum by Chl b-specific excitation, we subtract the fluorescence spectrum obtained by 440 nm light from that obtained by the 480-nm light after normalization at a Chl a-specific fluorescence peak such as a PSI fluorescence peak. D, three types of difference-spectra with normalization wavelengths at 720, 725, and 730 nm were derived by subtraction of the spectrum obtained by 440 nm excitation from the spectrum obtained by 480 nm excitation in A.

