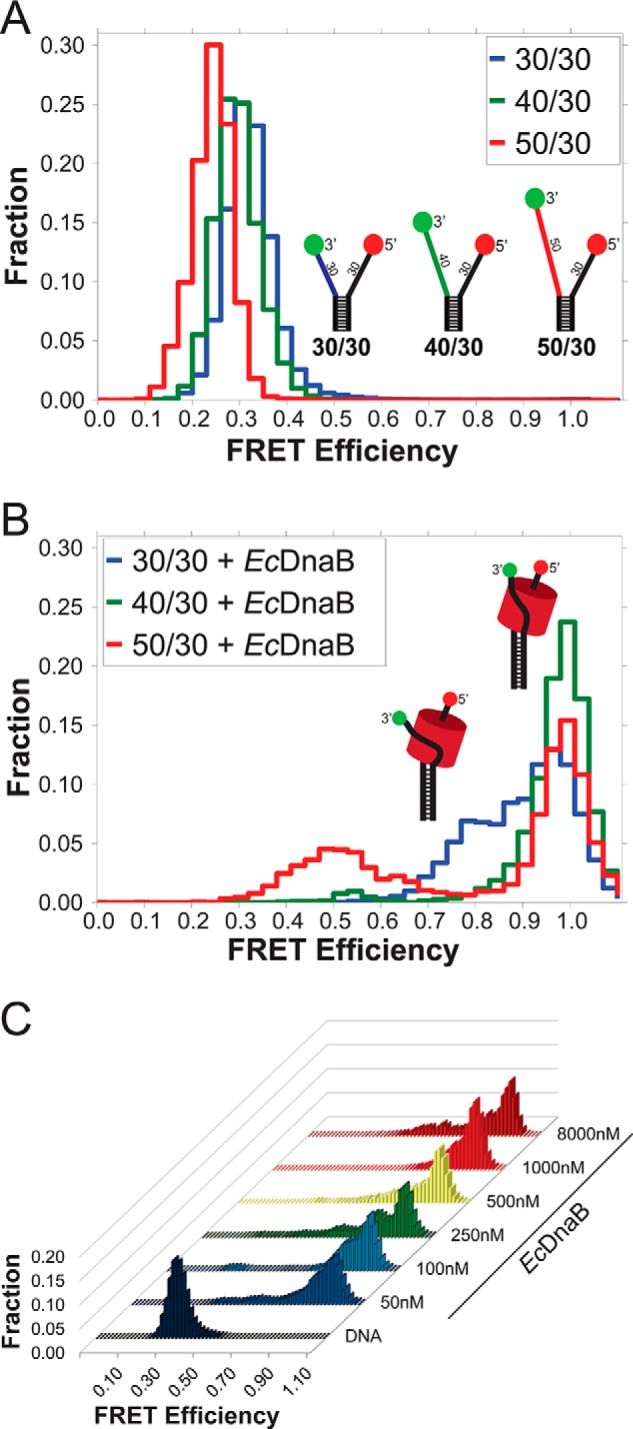
Figure 1.

Single-molecule FRET monitoring of EcDnaB binding to DNA fork substrates. A, histograms of the smFRET signal from the DNA fork substrates alone, colored to match schematic models of the DNA forks with a static 30-base encircled 5′-strand and variable excluded strand 3′-arm lengths (30, 40, and 50 nucleotides) shown in blue, green, and red, respectively. B, histograms of the three DNA substrates in the presence of 250 nm WT EcDnaB. C, histogram profiles from a titration of WT EcDnaB onto the 30/30 fork substrate from 50 nm to 8 μm are shown. 30/30 alone exhibits low FRET (shown in dark blue). Adding WT EcDnaB shifts the FRET signal to higher FRET values in all cases without significantly altering the histogram profile.
