
Figure 2.
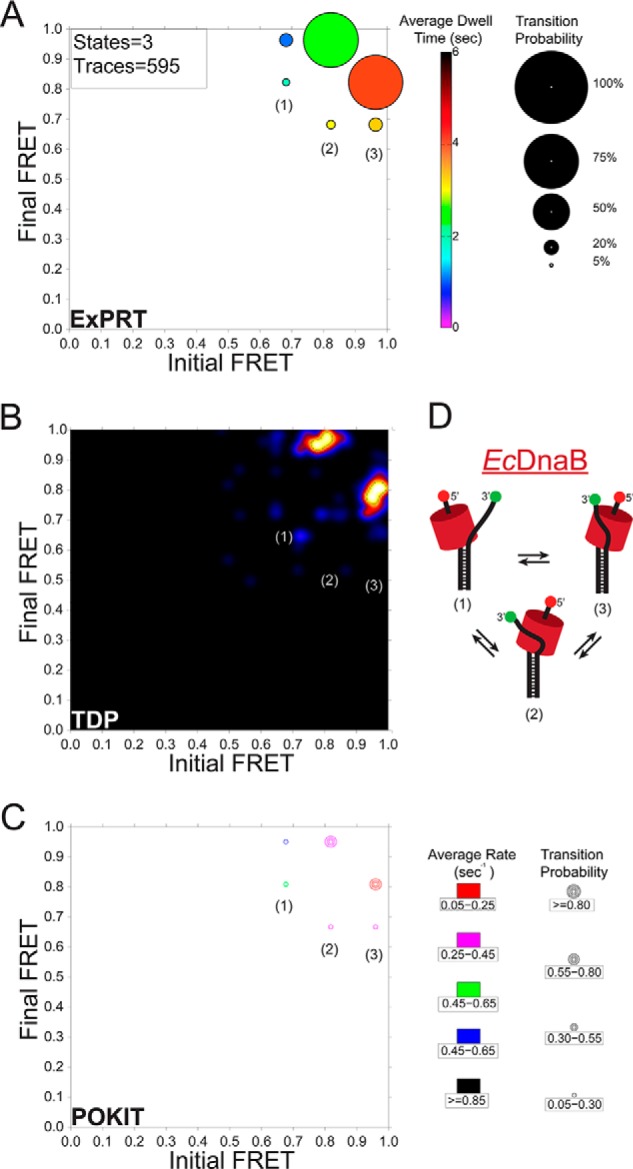
Comparison of smFRET dynamics for excluded strand interactions on EcDnaB. A, ExPRT plot showing the probability (size) and dwell time (color) of transitions for EcDnaB (250 nm) on 30/30 fork DNA. The numbers of states and traces fit by the data are in the upper left-hand corner for each plot. B, the smFRET data set from WT EcDnaB on 30/30 was also analyzed and fit using HaMMY and subsequently analyzed and visualized by the TDP. C, separately the same data were stitched together and fit using vbFRET and visualized using the POKIT analysis program. D, schematic representation of the hypothesized three states (1–3) of bound helicase to DNA fork identified in the ExPRT plots and indicated on each plot.