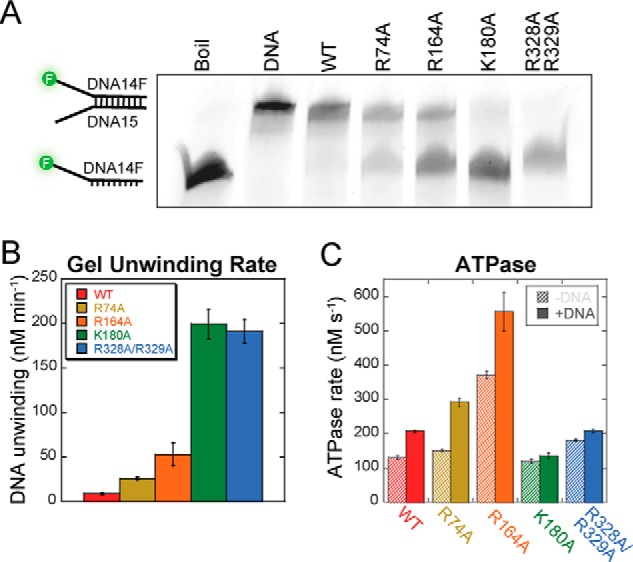
Figure 8.

Biochemical properties of SEW mutants of EcDnaB. A and B, a representative gel for 6-min time point is shown for EcDnaB (WT and mutants, 3 μm) unwinding assays performed on a fluorescein-labeled fork DNA (DNA14F/DNA15) (15 nm) (A) and quantified over multiple time points (B) is shown. Throughout, data for EcDnaB constructs are consistently colored (WT, red; R74A, ochre; R164A, orange; K180A, green; R328A/R329A, blue). Error bars represent the standard error from at least three independent experiments. C, quantification of the ATP hydrolysis rate in the absence (diagonal hash) and presence (solid) of fork DNA (DNA14/DNA15).
