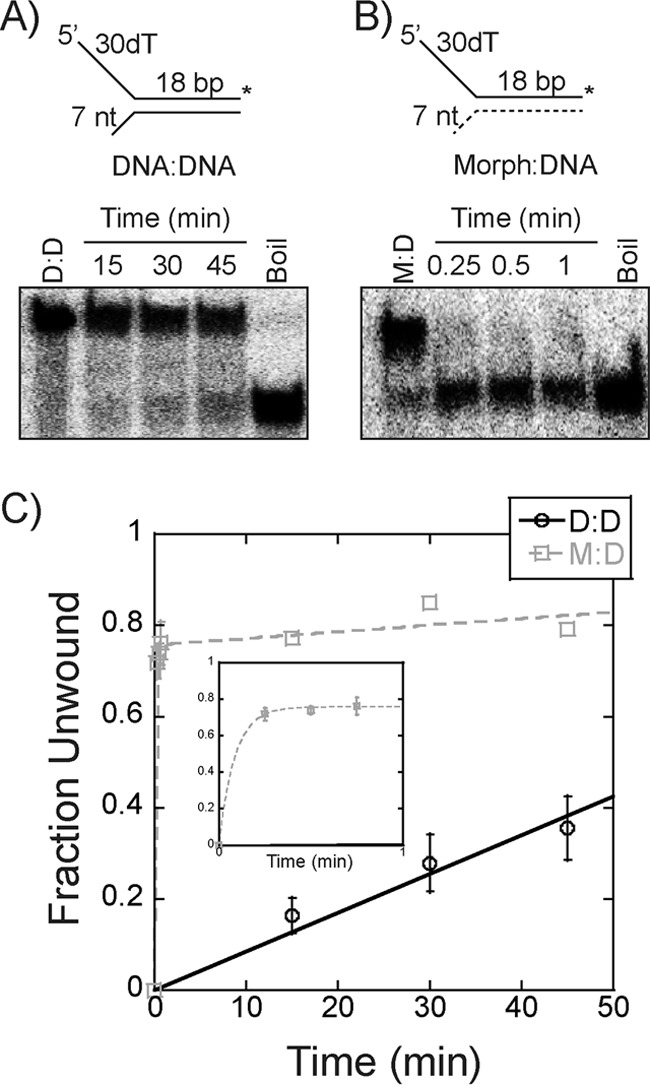
Figure 9.

Unwinding of morpholino forked substrates. A and B, a representative unwinding time course for 250 nm EcDnaB on either an 18-bp DNA/DNA (D:D) (A) or Morph/DNA (M:D) (B) substrate (15 nm) with a 7-base 3′-excluded strand flap is shown. Single-turnover experiments were initiated with ATP and a single-strand trap identical to the radiolabeled strand as described under “Experimental procedures.” C, averaged unwinding data for DNA/DNA (black ○) were plotted and fit with a linear regression to give k = 0.009 min−1, and those for Morph/DNA (gray □) were plotted and fit using Equation 3 to give k1 = 11 min−1. The inset plot highlights data within the 1st min. Error bars are the standard error from three independent experiments.
