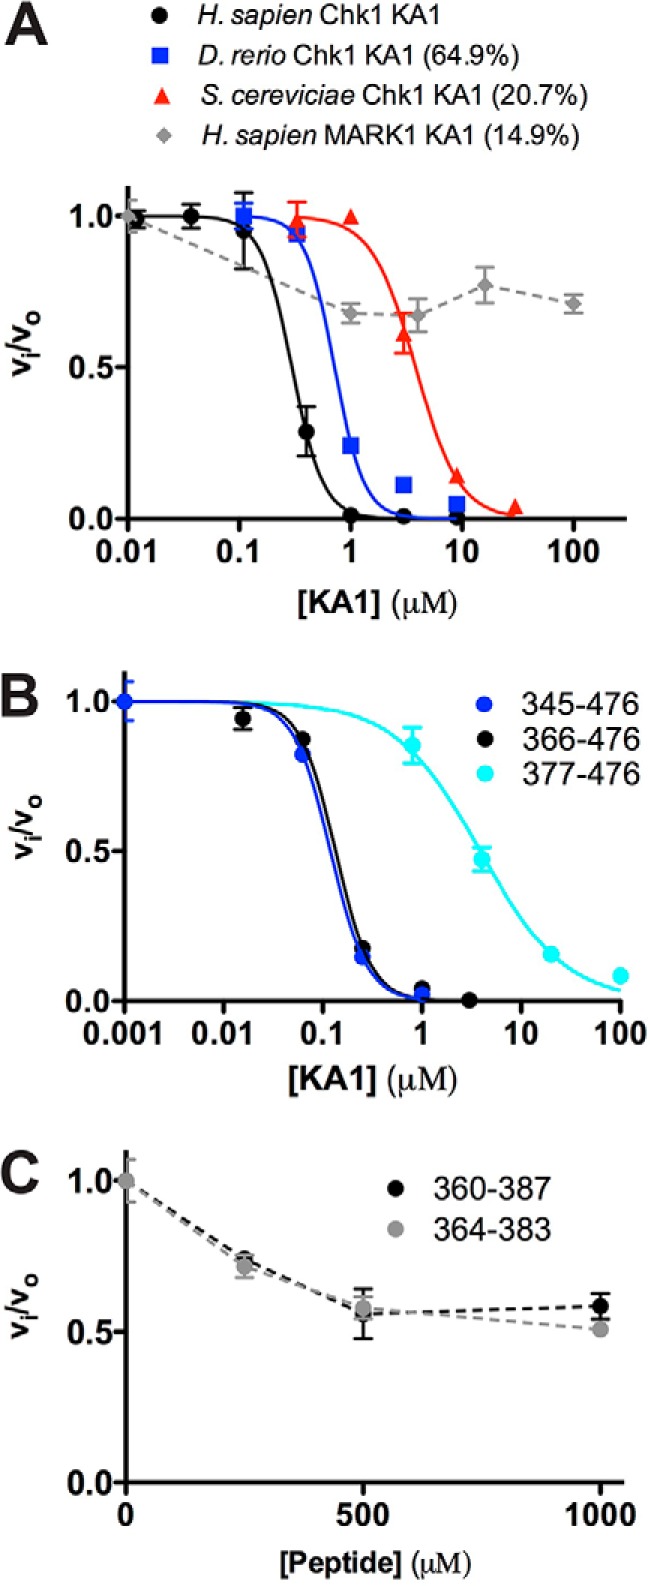
Figure 4.

KA1 domains inhibit the Chk1 kinase domain in trans. A and B, human Chk1 kinase domain (1–277) at 0.05 μm was assayed in the presence of increasing concentration of KA1 domain constructs. Where applicable, plots of fractional velocity versus concentration (mean ± S.D. of three replicates) were fit (solid lines) to calculate Ki for non-competitive inhibition and a Hill coefficient (n, see “Experimental procedures”). A, fits of KA1 domains from H. sapiens (366–476, black), D. rerio (301–410, blue), and S. cerevisiae (412–527, red) resulted in Ki values of 0.29 ± 0.01, 0.72 ± 0.08, and 3.82 ± 0.24 μm with Hill coefficients of 3.08 ± 0.14, 3.27 ± 0.92, and 2.20 ± 0.28, respectively. The MARK1 KA1 domain (683–795, gray) did not display strong enough inhibition to fit, indicated by a dashed line. Sequence identities compared with the human Chk1 KA1 domain construct are indicated. B, fits of human Chk1 KA1 constructs consisting of 345–476 (blue), 366–476 (black), or 377–476 (cyan) resulted in Ki values of 0.12 ± 0.01, 0.13 ± 0.01, and 3.86 ± 0.39 μm with Hill coefficients of 2.38 ± 0.09, 2.43 ± 0.24, and 1.01 ± 0.10, respectively. C, two peptides made up of CM1 only plus flanking sequence consisting of 360–387 (black) or 364–383 (gray) did not display enough inhibitory activity to be fit. Mean ± S.D. of three replicates are plotted, with dashed lines connecting the data points for clarity.
