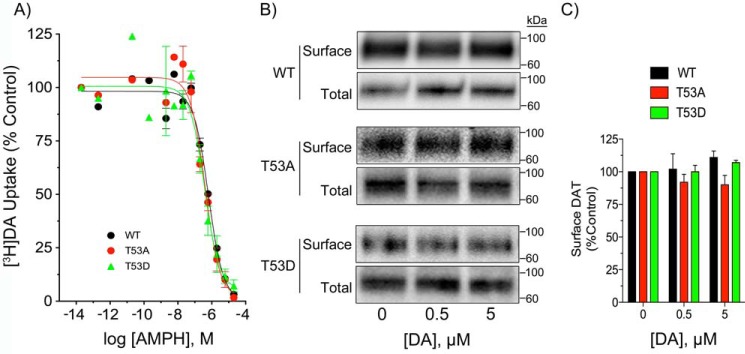
Figure 5.
AMPH concentration-dependence and surface biotinylation of WT, T53A, and T53D DATs. A, LLCPK1 cells expressing WT, T53A, or T53D DATs were analyzed for [3H]DA transport in the presence of the indicated concentrations of AMPH. Results are expressed as % control for each form and represent mean ± S.E. of three independent experiments. B, LLCPK1 cells expressing the indicated DAT forms were treated with vehicle, 0.5 μm DA, or 5 μm DA for 5 min and subjected to surface biotinylation. Equal amounts of protein for each form were analyzed for total and surface DAT levels. Quantification of surface levels for each form normalized to vehicle control is shown in panel C.

