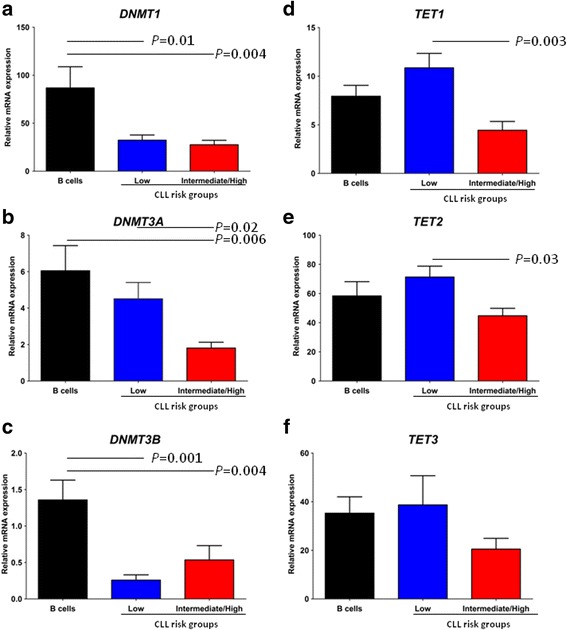
Fig. 4.

DNA methylation and demethylation regulators according to cytogenetic risk groups a DNMT1, b DNMT3A, c DNMT3B, d TET1, e TET2, and f TET3 were tested by real-time quantitative PCR and transcripts expressed relative to GAPDH. The mean ± standard error of the mean (SEM) values are indicated, and statistical differences were indicated when Dunn’s correction test was statistically significant (p < 0.05)
