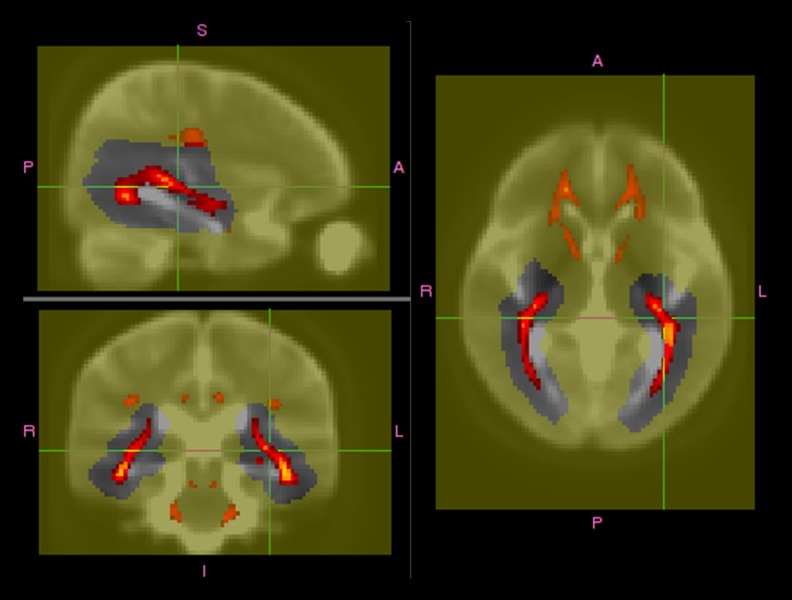
Figure 2.
Definition of the population-mean optic radiation (OR) region of interest (ROI) using DTI-based segmentation. The red–yellow color range, which runs from 0.5 to 1, represents the proportion of all subjects’ ROIs computed using the DTI method, coregistered using affine transformations, and thresholded. The background image is the average of all the coregistered b=0 images. The yellow color is the intersubject mask used to approximately locate the OR.

